




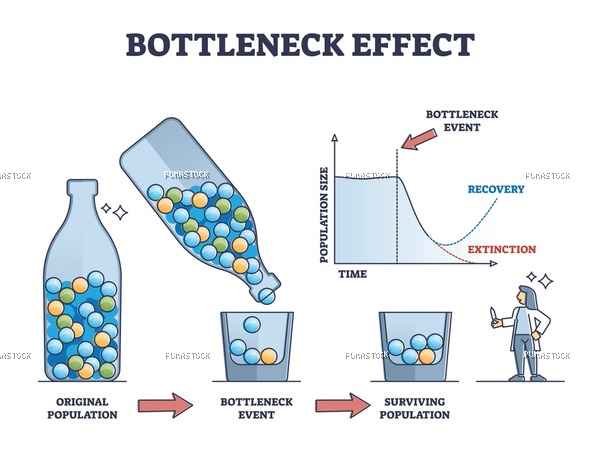
Bottleneck effect axis scheme on genetic drift and population outline diagram. Labeled graphic with time and species variation reduction after disaster event vector illustration. Nature change process

test test/739.17K
images
Bottleneck effect axis scheme on genetic drift and population outline diagram. Labeled graphic with time and species variation reduction after disaster event vector illustration. Nature change process
-
Image type EPS
-
Published -
-
Views 6
-
Downloads 0
|
$0.00 USD
Share
Related Photos
-
Watercolor hand drawn red seaweed, kelp leaves on white  test test
0
test test
0
-
Luxury Wedding Rose Seamless Pattern Watercolor Floral Elegant Romantic Background Design
test test
0
-
Germany bavaria thick fog floating over geroldsee lake at dawn
test test
0
-
Ditsy floral seamless pattern. Small little flower pattern background. Repeat pattern. Ditsy print. Liberty style. Botanic surface design. Ditsy floral for fashion, texture, fabric, wrapping, decor
test test
0
-
Lake mountain photo
test test
0
-
Mountain lake with crystal clear water
test test
0
-
Night forest scene
test test
0
-
Beautiful wedding seamless pattern with flowers and leaves. Illustration
test test
0
Give Thanks!
Give thanks to @alitest for sharing this photo, the easiest way, sharing on social network